
RESEARCH METHODS IN NEUROSCIENCE OF ADDICTION

“Whenever a theory appears to you as the only possible one, take this as a sign that you have neither understood the theory nor the problem which it was intended to solve.”
Karl Popper
Over the past 40 years addiction science has grown from a backwater field to one of the most active areas in neurobiology research. Much of this advance has been fueled by three principal tools: animal studies, PET and MRI.
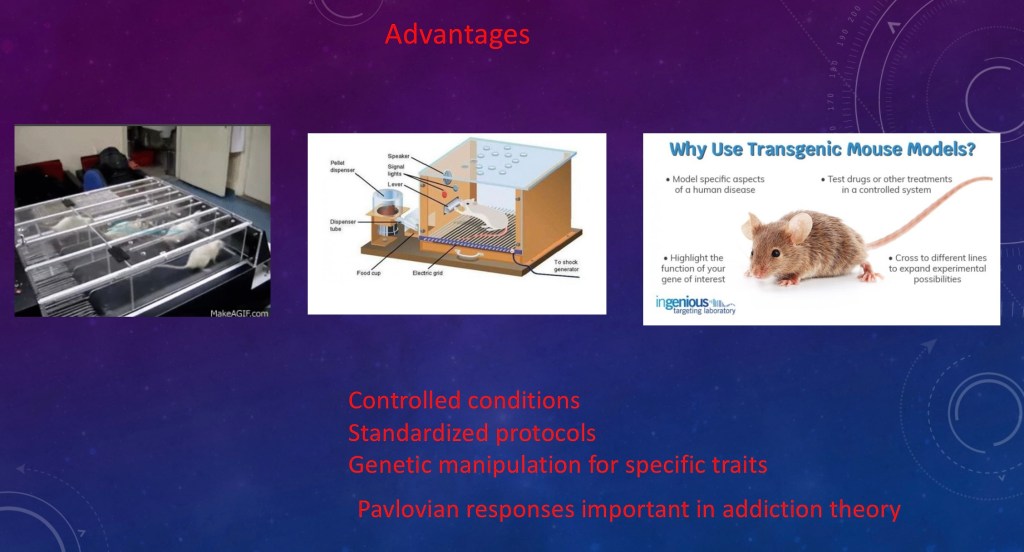
Animal Models

There are significant limitations inherent in animal models. Frequently findings which seem promising in animals such as drug trials, may be found to be ineffective or unsafe in humans.
There are practical reasons why mice and rats are so often used in basic science. They are easy to handle and take care of. They breed and mature quickly so they can be studied at different stages of life cycle. Lines can be bred for specific traits or behaviors.
Pavlovian conditioning can be studied in animals. However it is questionable if these observations can be related to “choice” “preference” or “motivation” as applied to people. With some possible exemptions, people are simply not rats.

A common model is the “two bottle choice” test. The animals are given a choice between a drug solution or sugar water and observed as to preference. Various experimental conditions can be made such as inducing drug dependence prior to the test, pharmacological agents, invasive methods, any number of controlled variables.

The discovery of dopamine as a neurotransmitter associated with addictive drugs was found by animal experiments. A spike in dopamine level in a specific brain structure, the nucleus accumbens, was observed following amphetamine administration.
The dopaminergic reward pathway is now known to be essential in development of substance use disorder.
These studies were done using microdialysis in animals.

Microdialysis has been around since the 1960s. Under anesthesia a tiny catheter with a semipermeable membrane is placed into a specific structure. The catheter is now in the interstitial fluid around cells which can be analyzed for chemical levels before and after a drug or stimulus is applied. This can be done anywhere in the body.
Mice can be bred for specific phenotypic traits such as alcohol tolerance. Transgenic mice can be created by changing DNA coding. DNA coding for neurotransmitters, receptors, or transporters can be altered. Animals in whom a specific gene has been rendered inoperable are called “knockout mice”.
Magnetic Resonance Imaging

MRI is a mainstay in clinical medicine and has found broad application as a research tool. It is safe, commercially available and has undergone continued improvement since its introduction in the 1970s and 80s.
MR physics are complex and are based on quantum mechanics, however the basic concepts are not difficult and thankfully can be explained with basic physics.
One thing to keep in mind is that what you are looking at is a jumble of radio frequency waves assembled into an image. It that respect it is not “reality”.
The magnet does not change. What changes are the radio waves sent out into tissue and the signal “echo” received back. Energy in = Energy out.
The magnet is a superconducting magnet cooled with liquid Helium. Even small inhomogeneities or motion can effect image quality. Metal, such as from a hip implant, causes local distortion of the magnetic field and degrades image quality. Because of this, the room is shielded with a faraday cage to protect from outside interference.

HOW MRI WORKS
- When you are inside the bore of the scanner, under a strong magnetic field, your hydrogen protons (as in water) spin like a top and line up like little magnets parallel to the magnetic field.
- Metal coils in the scanner send out a strong radio pulse giving energy to the protons and knocking them out of alignment (transmitter coils). The coils going off are the loud noises you hear.
- When the protons come back into alignment, they give out a weak radio signal which is picked up by receiver coils (like an antenna).
- These signals differ slightly depending on the type of tissue they come from (such as fat, water, brain).
- The signals are then processed into an image

Here is the inside of an MRI unit showing the coils and electronics inside the ring of the main magnet. Most current magnets are 1.5 Tesla. There are some 3.0 Tesla and a few stronger research magnets out there. One Tesla is powerful enough to lift a car.
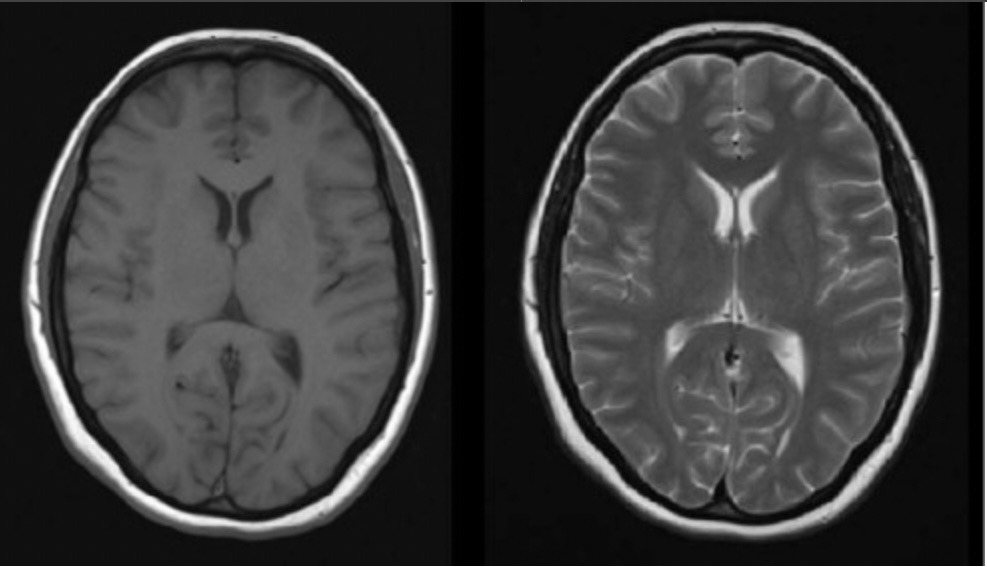
By changing the parameters, such as frequency of firing and the time when you listen to the “echo”, you get pulse sequences with different properties . T1 – Fluid is dark. T2 Fluid is bright. There are many variations.
fMRI

fMRI is primarily used as a research tool.
fMRI is an indirect measure of changes in regional blood flow. It does not directly measure brain function.
It is uses BOLD sequence – Blood Oxygen Level Dependent
The signal you see represented as a color scale reflects a slight magnetic change which occurs when blood gives up its oxygen as it passes through tissue. It is a very small signal change.
F MRI Requires a higher strength magnet than most clinical units and specialized software. Results are highly software dependent, which may cause errors in interpretation if software parameters are incorrect.
Blood flow does not necessarily correspond to function. This is called the “hemodynamic coupling problem”.
fMRI has been criticized for having poor positive predictive value. It may be subject to false positives.
Another limitation is that because of the time and expense involved it does not lend itself to large scale studies. Control subjects should be carefully matched with the study population because of potential confounding factors such as age, sex, or other variables.
One advantage is that experiments can be done under controlled conditions. However it is questionable if lab results apply to more complex “real world” conditions as well as accounting for individual variations in brain structure and function.
Nonetheless it is a valuable tool. It can clue you in to areas of activity in response to a specific stimulus.
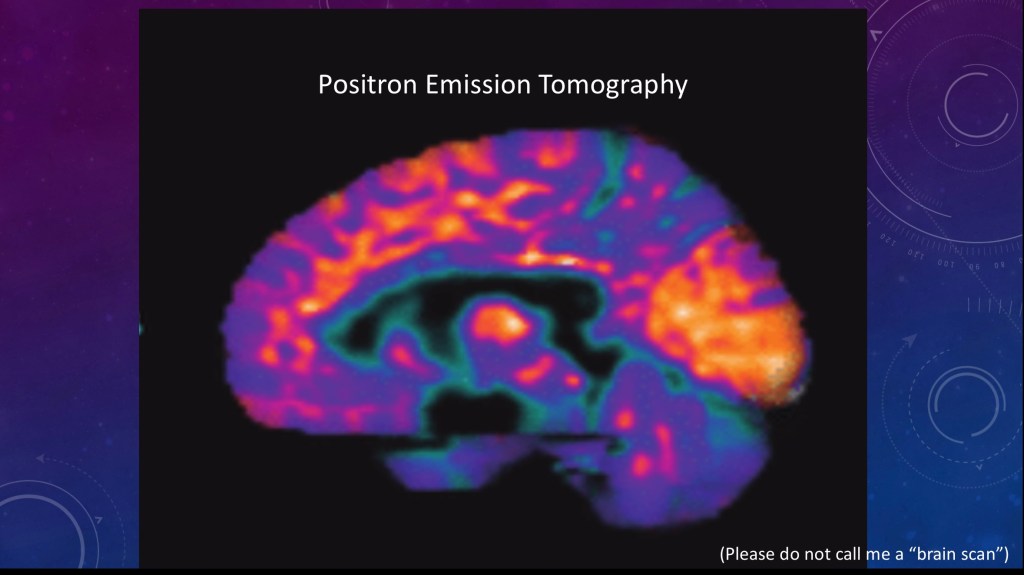
PET
(my favorite)
Positron emission is a type of nuclear radiation. Tomography is an imaging technique which allows you to get 2d and 3d images.
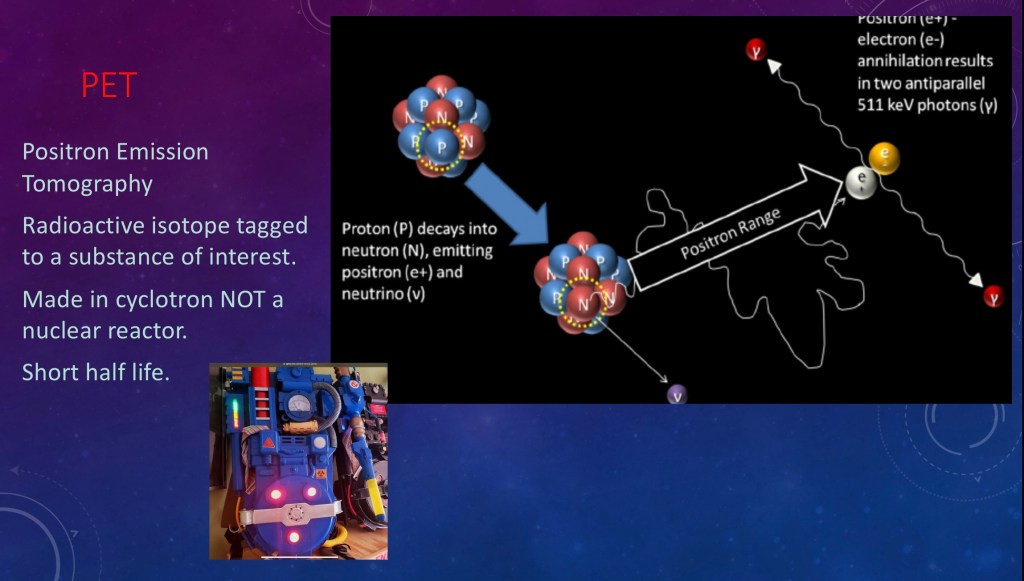
A positron is what you get when a proton decays into a neutron (and a neutrino, we don’t care about those).
The energy and charge have to go somewhere so out shoots a positron. A positron isthe opposite of an electron.
There are lots of electrons whirling around so the positron eventually collides with one. When it does they annihilate each other (boom!).
The resulting energy comes out as two gamma rays in opposite directions. This radiation is picked up by the ring of detectors. The counts are added up and processed into an image. Because the detectors are very sensitive only a small dose, too small to cause a risk, is needed for imaging.
Positron emitters are made in a cyclotron (a particle accelerator) so you don’t need a nuclear reactor. Cyclotrons are more readily available and do not pose a significant radiation hazard.
The round thing on the ghostbuster backpack was supposed to be a miniature cyclotron (whatever you do. Don’t cross the beams!). The largest one is the CERN facility in Switzerland, it is 28 km in length.
P+ emitters have short half lives. This is an advantage as it decreases radiation dose and allows for repeat imaging soon after a first dose. However the isotope usually needs to be used soon after it is made.
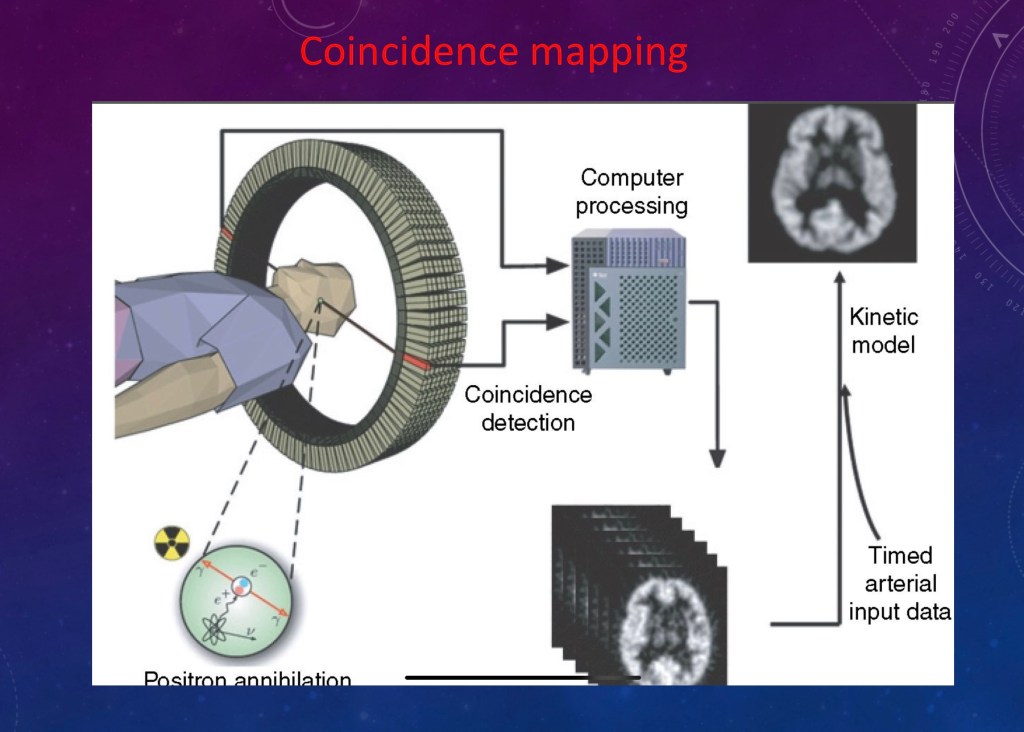
You can then detect and map activity to location and intensity.
Agents used for PET imaging
P+ emitters are made from common atoms found in the body (i.e. Carbon, Nitrogen Oxygen)
So you can attach the isotope to something you want to look at like Glucose, cocaine, or a transporter protein by swapping the charged atom for something already there using a chemical reaction.
Now you have radioactive cocaine, dopamine, glucose, a neurotransmitter, or whatever you want to look at.
Inject it and see where it goes in the body.

This is glucose (fDG) used for cancer staging. Note a lot of activity in the heart and brain partially seen at the very top. Brains and hearts are energy hogs. Also some is excreted into the urinary system.
UPTAKE VALUES
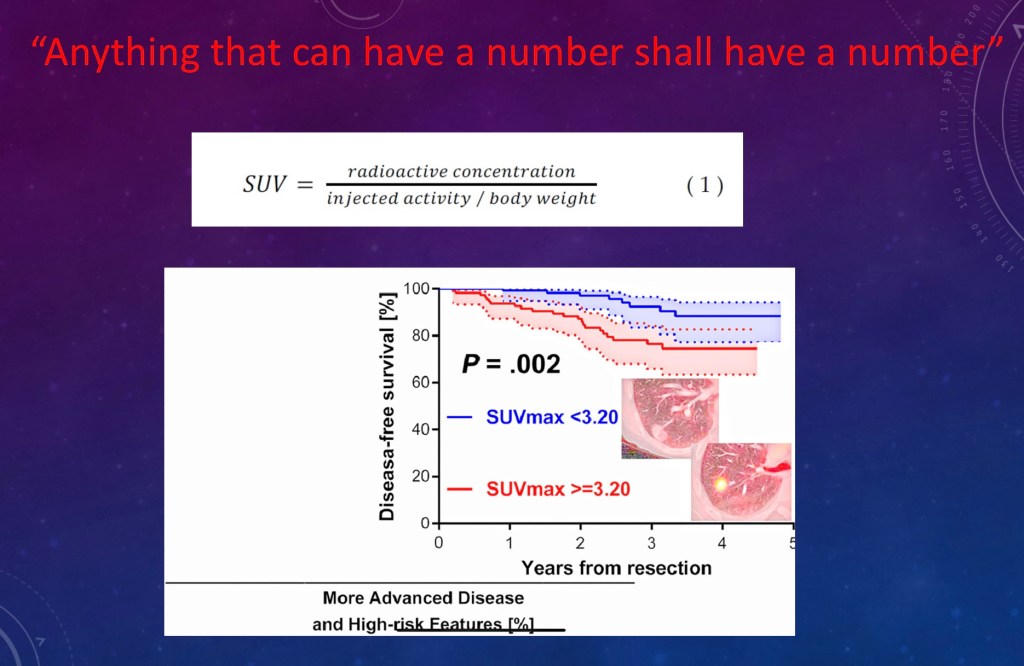
It seems to be a rule of science that anything that can have a number shall have a number.
Science types love charts and graphs. This is just an example of what you can do.
Color scales are arbitrary and help you for viewing but don’t tell you if you are seeing large or small differences.
You can calculate a Standard Uptake Value (SUV) which accounts for variables like body size. Then you can compare one study to another.

This is an example from addiction neuroscience. They labeled a dopamine transporter protein. The transporter regulates dopamine levels at the neural synapses. This was one of the many PET studies done at Brookhaven National Lab in New York, a branch of the NIDA – NIH.
This is a summary of what they found. On the left is a Control subject—-then Meth user 1 month abstinent—-Meth user 24 months abstinent.
This was an important study when it came out (2001). It is one of the early studies showing physical brain changes in addiction even when abstinent. This was a controversial theory at the time.
Many other studies have shown similar results from other addictive substances and other neural pathways involved.
PET Limitations
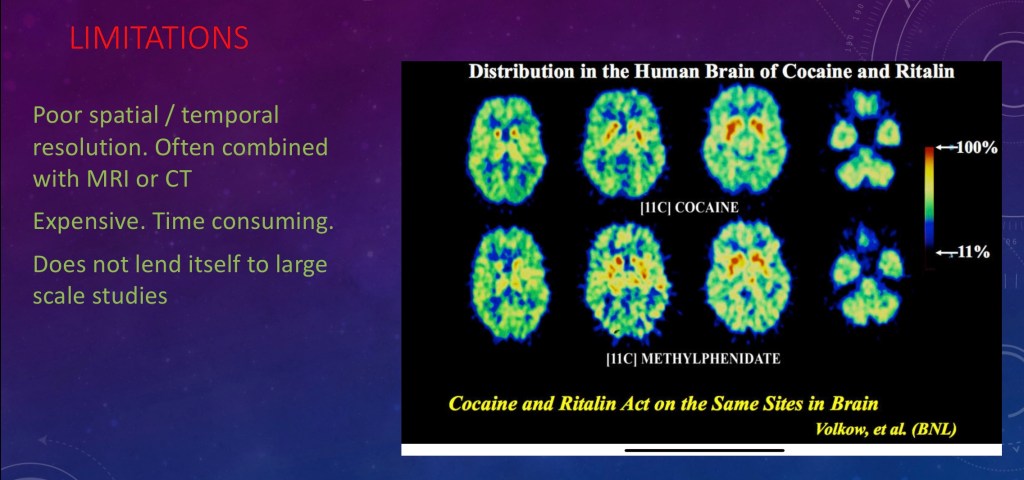
PET does not have very good spatial resolution so it is often combined with MRI or CT.
There is an acquisition time problem. It takes seconds to minutes to get an image. Neurons fire in milliseconds so you may miss some changes.
PET does not lend itself to large scale studies due to time and expense so the population studied is usually small.
Results are very software dependent so comparison with other centers may not be accurate. Parameters used for processing may not reflect functional change.
In general PET has a high degree of specificity in that it measures what you intend to measure. Specificity reflects the true negative rate. It can have low sensitivity due to small changes in the degree of radioactivity which may result in a low true positive rate. You may be counting some actual positive change as negative.

The above example shows some different things you can label which are important for neuroimaging and how versatile PET is. These are Receptors for Dopamine, Serotonin, Cannabinoid, Glutamate, and Adenosine.

Newer Stuff – DNA modification in vivo
This is an example of a mouse study using DNA modification targeting medium spiny neurons in the dopaminergic reward pathway. The neuron at the top was tagged with a fluorescent marker using DNA modification. An inactive virus is usually used to get the modified DNA into the cell.
There are 2 groups of dopamine receptors D1 and D2. They wanted to see how each type affects affinity for alcohol.
In this study they modified the gene for dopamine receptors using a virus as a vector to place the DNA sequence into the mouse brains in the nucleus accumbens.
It turns out that blocking D1 or D2 individually does nothing however blocking both at the same time results in compulsive drinking.
STUDY THE STUDY

.
In looking at a study I want to know what they actually did and how they went about it. What question is being asked and what did the results support or not support? What were the potential limitations? Are the findings supported by other evidence?
Study sample size and selection is always important. The magnitude of reported differences in what was measured, was it a large or small effect, is often opaque and couched in statistical terms.
Much of the research in this field is hampered by the difficulty in obtaining a large enough study size to account for population heterogeneity and inability to detect small but significant findings.
If you have gotten this far thank you for your time and consideration. I hope it may be helpful in the search for better knowledge and understanding. Any feedback would be appreciated.

REFERENCES
Comparative Study
Alcohol Clin Exp Res
2008 Dec;32(12):2041-6.
doi: 10.1111/j.1530-0277.2008.00791.x. Epub 2008 Sep 25.
Learning in the 2-bottle alcohol preference test
David A Blizard 1, David J Vandenbergh, Arimantas Lionikas, Gerald E McClearn
https://pubmed.ncbi.nlm.nih.gov/18828810/
………………………………..
Positron Emission Tomography Molecular Imaging of Dopaminergic System in Drug Addiction
Haifeng Hou, Mei Tian, Hong Zhang
First published: 30 March 2012
https://anatomypubs.onlinelibrary.wiley.com/doi/10.1002/ar.22457
………………………………
What we can do and what we cannot do with fMRI
Nikos K. Logothetis1
Vol 453j12 June 2008jdoi:10.1038/nature06976
……………………………………
MR physics for physicians
- Stuart Currie1,
- Nigel Hoggard1,
- Ian J Craven1,
- Marios Hadjivassiliou2,
- Iain D Wilkinson1
- Correspondence to Dr Stuart Currie, Academic Unit of Radiology, University of Sheffield,
https://pmj.bmj.com/content/89/1050/209
………………
Effects of alcohol on the membrane excitability and synaptic transmission of medium spiny neurons in the nucleus accumbens
Vincent N. Marty, Igor Spigelman
https://www.sciencedirect.com/science/article/abs/pii/S0741832911005234
…………………………
………………………………..
Loss of Dopamine Transporters in Methamphetamine Abusers Recovers with Protracted Abstinence
Nora D. Volkow, Linda Chang, Gene-Jack Wang, Joanna S. Fowler, Dinko Franceschi, Mark Sedler, Samuel J. Gatley, Eric Miller, Robert Hitzemann, Yu-Shin Ding and Jean Logan
Journal of Neuroscience 1 December 2001, 21 (23
https://www.jneurosci.org/content/21/23/9414
………………………………………
Dysfunction of the prefrontal cortex in addiction: neuroimaging findings and clinical implications
Nat Rev Neurosci. Author manuscript; available in PMC 2012 Oct 2.Published in final edited form as:Nat Rev Neurosci. 2011 Oct 20; 12(11): 652–669. Published online 2011 Oct 20. doi: 10.1038/nrn3119
PMCID: PMC3462342NIHMSID: NIHMS408806PMID
Volkow NM
https://www.ncbi.nlm.nih.gov/pmc/articles/PMC3462342/
………………………………
Front. Neurosci., 12 January 2022
Sec. Neuropharmacology
Volume 15 – 2021 | https://doi.org/10.3389/fnins.2021.811192
https://www.frontiersin.org/articles/10.3389/fnins.2021.811192/full
Identification of the Risk Genes Associated With Vulnerability to Addiction: Major Findings From Transgenic Animals
Chloe J. Jordan1* and Zheng-Xiong Xi2*
………………………………………………………………..
Cluster failure: Why fMRI inferences for spatial extent have inflated false-positive rates
Anders Eklund anders.eklund@liu.se, Thomas E. Nichols, and Hans KnutssonAuthors Info & Affiliations
Edited by Emery N. Brown, Massachusetts General Hospital, Boston, MA, and approved May 17, 2016 (received for review February 12, 2016
https://www.pnas.org/doi/10.1073/pnas.1602413113
………….
for educational and informational purposes only. No commercial or institutional interest.

Leave a reply to Memory – Pathways 4 – Sober Synthesis Cancel reply